 Grains –
Loads of data from NASS yesterday afternoon…
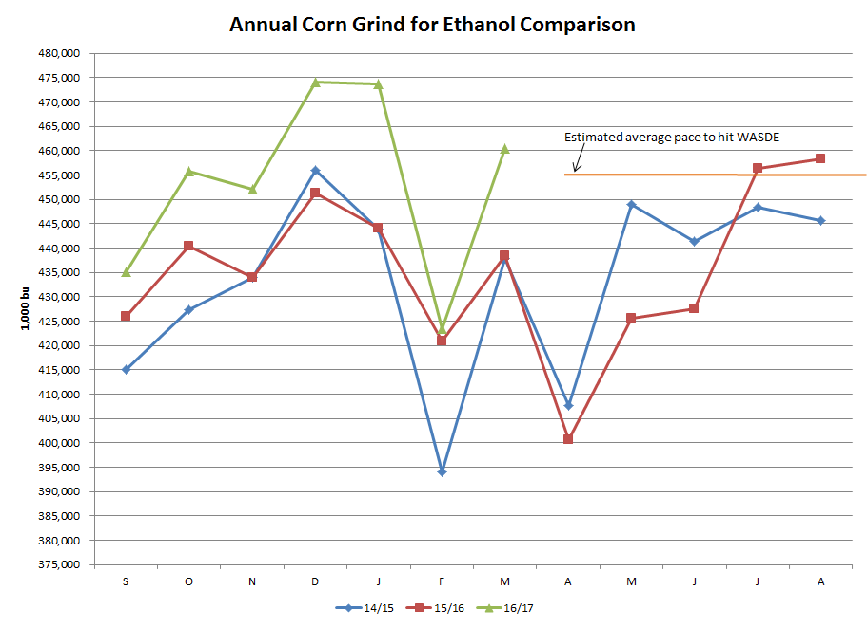
First off, the monthly Grain Crushing report showed a much smaller than expected corn grind for ethanol than I had been penciling. NASS is reporting a March corn grind of roughly 460 mil bu, compared to my expectations for something +’/- 475 mil bu. Part of my miss stems from fairly strong sorghum use during the month, totaling just under 13 mil bu. I think there might be a discussion on whether WASDE needs to raise their FSI use in sorghum on this, but perhaps they can wait another month or two for more data.
This miss vs. expectations for the corn grind does change the narrative a bit on expectations for a stronger WASDE ethanol projection going forward. Note the chart attached, which shows that the monthly grind going forward will need to average 455 mil bu for the remainder of the year. Based on the EIA data, I would guess that April would come close to meeting this average pace but then again I was wrong about the March number. I still think odds favor a higher eventual corn grind as the production pace should seasonally increase during summer, but WASDE should not feel any pressure to make a change this month.
The Fats & Oils report was an absolute hot mess. Firstly, the overall industry crush figure was presented at roughly 160 mil bu which is roughly 3 mil bu below what was implied based on the NOPA figure. The NASS crush figure was only 104.5% of the NOPA figure, which is the lowest percentage I show since the new F&O report began in 2015. It compares to an average of roughly 106.5% of NOPA. This is yet another signal that WASDE will have to lower their crush projection this month. I’m starting to wonder if the final crush could be as low as 1,900 mil bu (or lower?).
Making matters worse, the implied domestic meal use figure was literally off the chart low. I’ve since reconfigured the chart and I’ve attached it here. Now this isn’t a huge surprise. Note we exported a massive amount of meal in March, and the basic arithmetic of this calculation would mean implied domestic use would suffer. Still, after this month’s weak figure, MYTD implied domestic use is now running about 2% under last year. WASDE is currently forecasting a 2.6% YOY increase in domestic consumption.

The bottom line is I expect WASDE to lower their crush projection by at least 20 mil bu this month and this will be offset in the product balance sheets by lower domestic consumption.
Please note this is just a small sampling of commentary available to clients. Please visit www.nesvick.com for more information.
DISCLAIMER:
The information contained herein has been taken from trade and statistical services and other sources we believe are reliable. Opinions expressed reflect judgments at this date and are subject to change without notice. These materials represent the opinions and viewpoints of the author and do not necessarily reflect the opinions or trading strategies of Nesvick Trading Group LLC and its subsidiaries. Nesvick Trading Group, LLC does not guarantee that such information is accurate or complete and it should not be relied upon as such. Officers, employees, and affiliates of Nesvick Trading Group, LLC may or may not, from time to time, have long or short positions in, and buy or sell, the securities and derivatives (for their own account or others), if any, referred to in this commentary. There is risk of loss in trading futures and options and it is not suitable for all investors. PAST RESULTS ARE NOT NECESSARILY INDICATIVE OF FUTURE RETURNS. Nesvick Trading Group LLC is not responsible for any redistribution of this material by third parties or any trading decision taken by persons not intended to view this material.